Inverted yield curve explained

Photo by James Coleman on Unsplash
When it comes to bonds, a longer maturity usually means a higher yield. Long-dated bonds offer higher yields to compensate for the risk of holding a bond for a longer term and for the opportunity costs of doing so. After all, if you buy a 20 year bond and hold it to maturity, that principal isn't available for other things. You can often sell the bond to free up some capital, but you may have to sell at a loss. A higher yield helps compensate for that risk.
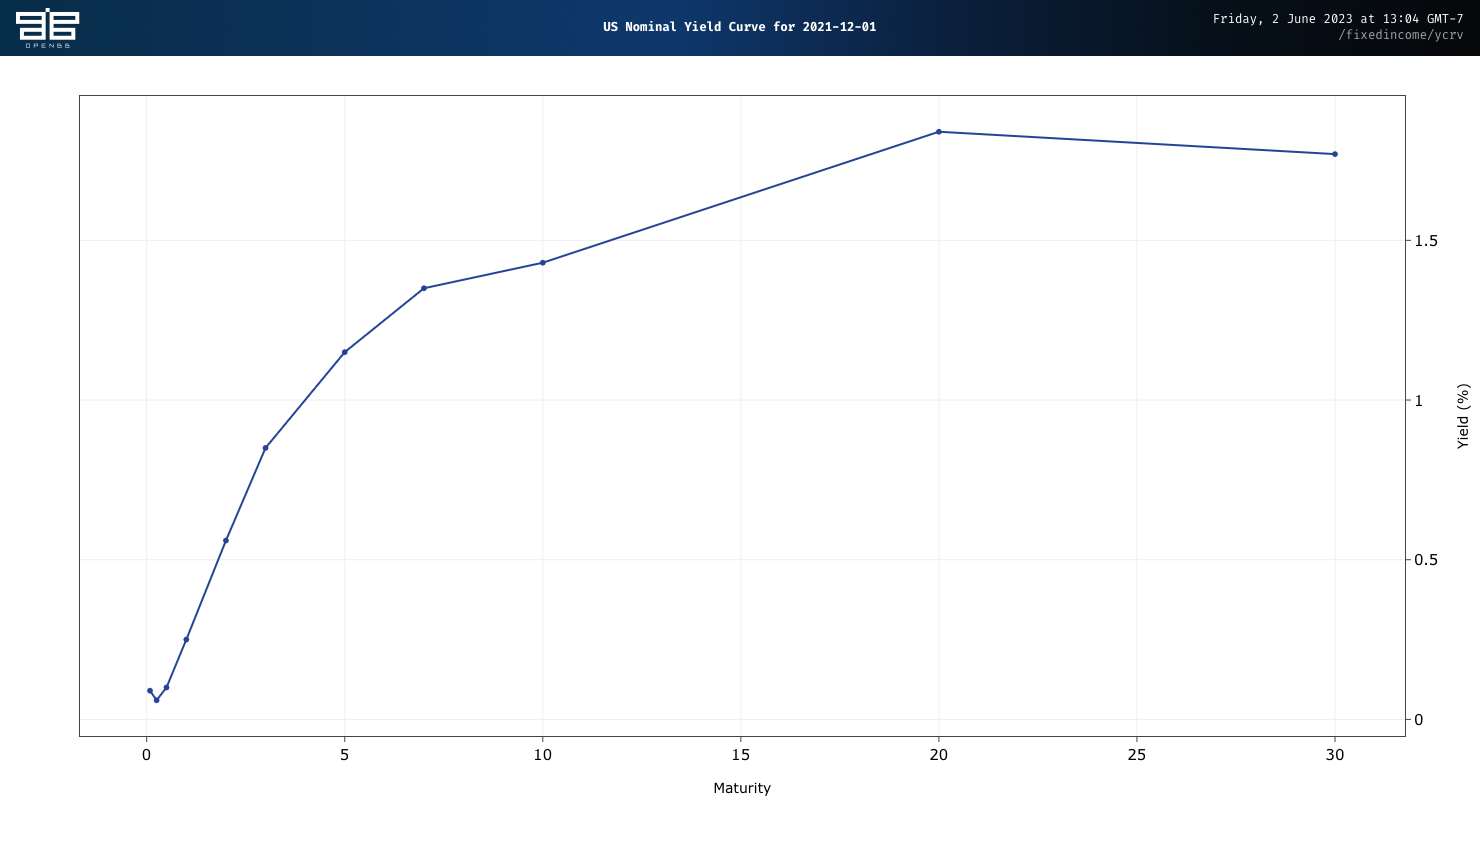
Most of the time, United States treasuries — treasury bills, treasury notes, and 20 or 30 year treasury bonds — adhere to this rule. If we place bond maturities and yield on a chart, it tends to look like Figure 1. This is a normal yield curve.

According to this chart, four week treasury notes yielded 0.05% on December 1, 2021. Twenty year bonds yielded 1.99%. Thirty year bonds yielded slightly less than the 20 year bond at 1.95%. What's important to notice here is that the curve slopes up.
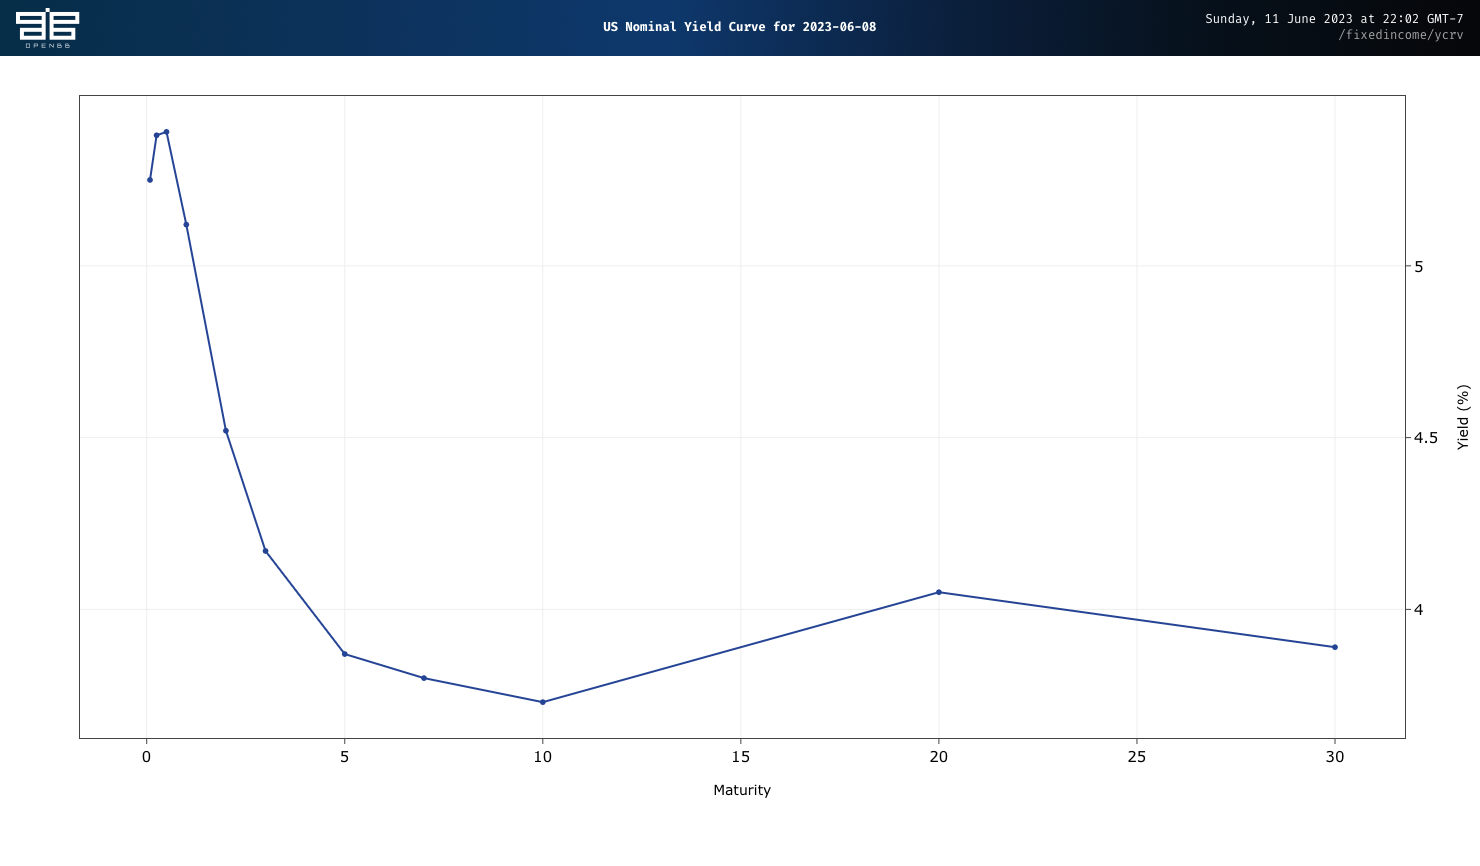
Sometimes, though, short-term bonds pay higher yields than long-term bonds. Figure 2 shows the yield curve as of June 8, 2023.

On that date, the annualized yield for a 4-week treasury bill was 5.25%. Ten year treasury notes yielded 3.73% annually. Twenty year bonds were slightly higher, at 4.05%. Thirty year bonds offered a yield of 3.89%. Notice that in this chart, the curve mostly slopes down.
When the yield on bonds with short-maturities exceeds the yield on bonds with long maturities, it's known as an inverted yield curve.
Why does this matter?
Inverted yield curves are widely believed to be a harbinger of recession. When the yield curve inverts for a full calendar quarter, a recession tends to follow. An inverted yield curve has predicted every recession since 1969.
Central banks tend to cut interest rates in the wake of a recession, to encourage spending and investment. When short-term yields are higher than long-term yields, it reflects a fear that the economy will contract in the short-term, requiring interest rate cuts in the medium-to-long term. Or as Investopedia explains:
Historically, protracted inversions of the yield curve have preceded recessions in the United States. An inverted yield curve reflects investors’ expectations for a decline in longer-term interest rates as a result of a deteriorating economic performance.
An inverted yield curve doesn't mean that a recession will definitely happen, however. Whether one does depends also on other macroeconomic factors, such as the unemployment rate, and levels of household debt and savings.
In fact, low unemployment and lower levels of household debt could mean the curve is giving us a false positive this time. Campell R. Harvey, the economist who first articulated the connection between recessions and inverted bond yield curves argues as much in The inverted yield curve is screaming RECESSION, an episode of Planet Money from NPR from April of 2023. Of course, only time can reveal whether Harvey was correct.
More about inverted yield curves
- Midcaps, AI, and Apple's New Headset
- In this episode of Barron's Streetwise podcast, Citi strategist Kristen Bitterly offers some advice for navigating the current bond market. Key takeaway: buy bonds with longer maturities to lock in higher interest rates. If we are entering a recession, coupon rates for longer term bonds will most likely fall.
- An inverted yield curve: why investors are watching closely
- An explanation of yield curves, complete with a fun feature that lets you hear changes in the yield curve over time. From the Financial Times, April 2022.
- Treasury yields invert as investors weigh risk of recession
- Another explanation of yield curves from U.S. Bank Wealth Management. Some analysts argue that the spread between the three month treasury bill and the ten year treasury note is most predictive of a recession.